Word-clouds with R
What are the most used words in Sherlock Holmes? Let's make word-clouds and find out!
What are the most used words in Sherlock Holmes? Let's make word-clouds and find out!
What does the graph of the (Kincaid) reading level of the US inaugural addresses look like?
What does the graph look like when you convert each prime to binary and plot the ones versus the zeros?
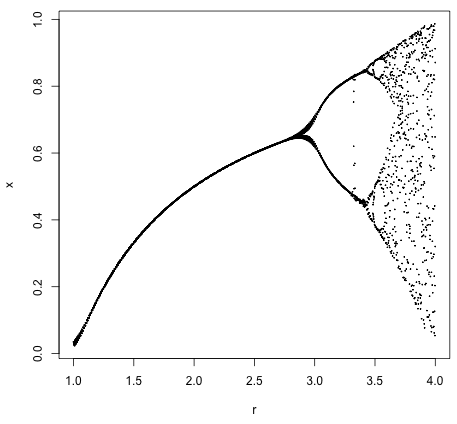 Yesterday, I decided to plot the bifurcation diagram of the logistic equation. This is a famous plot from the 70s, with which many geeks will be familiar. It shows that simple systems can switch into "chaos mode" and begin to bifurcate wildly.
tl;dr: bifurcation.R
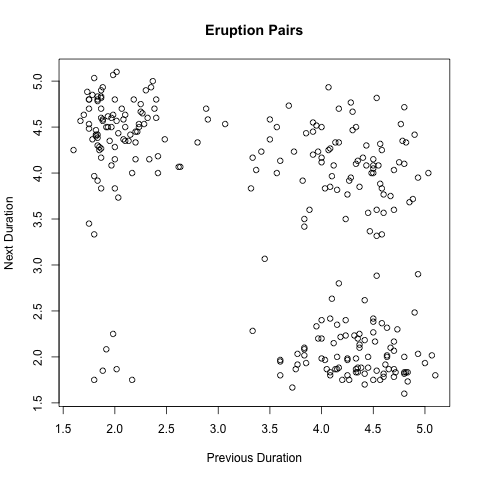 Because of the observed data, a four group clustering emerges when successive eruption durations of the famous geyser are plotted. The x axis is the first eruption and y is the next.
Continue reading Time-Successive Old Faithful Eruption Durations...