Of Hexagons, Kites and Tiles
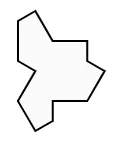
 I recently read about the 13-sided "Einstein shape" (or hat/t-shirt tile) on a hexagonal grid of kites. Being a curious cat and programmer, I had to find out more! (tl;dr: hexagon-grid and animation at the bottom)
 I recently read about the 13-sided "Einstein shape" (or hat/t-shirt tile) on a hexagonal grid of kites. Being a curious cat and programmer, I had to find out more! (tl;dr: hexagon-grid and animation at the bottom)
![]() Tonight I became curious as to what an image would sound like when "played" one pixel at a time.
Tonight I became curious as to what an image would sound like when "played" one pixel at a time.
tl;dr: The play-pixels program.
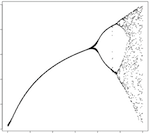
 Yesterday, I decided to plot the bifurcation diagram of the logistic equation. This is a famous plot from the 70s, with which many geeks will be familiar. It shows that simple systems can switch into "chaos mode" and begin to bifurcate wildly.
tl;dr: bifurcation.R
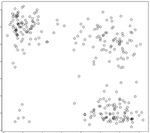
 Because of the observed data, a four group clustering emerges when successive eruption durations of the famous geyser are plotted. The x axis is the first eruption and y is the next.
Continue reading Time-Successive Old Faithful Eruption Durations...