Musical Fingerprints with Radar Charts
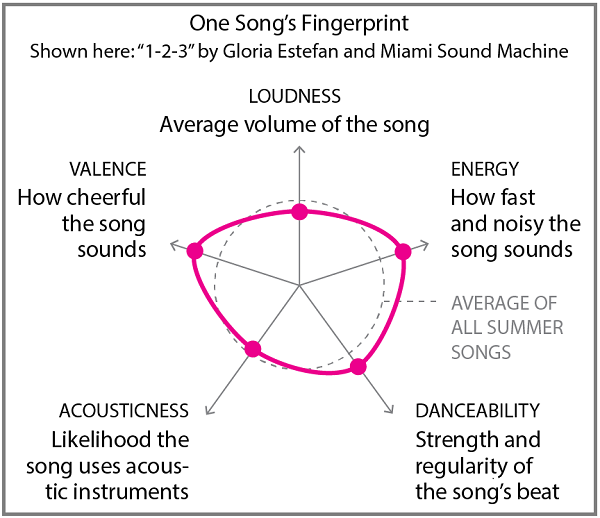 I stumbled across this link with this cool chart.
Naturally I wondered if I could replicate this and analyze some music like ...my own! My last release, "X" is on MusicBrainz. So lets see...
Code: analyze-low-level
The code uses a number of libraries to get the job done:
GD::Chart::Radial, Math::Utils, Mojo::File, Statistics::Basic, WebService::AcousticBrainz, and WebService::MusicBrainz
It's small but handy! Please see the code link above for the exciting details. But these types of images are what it produces:
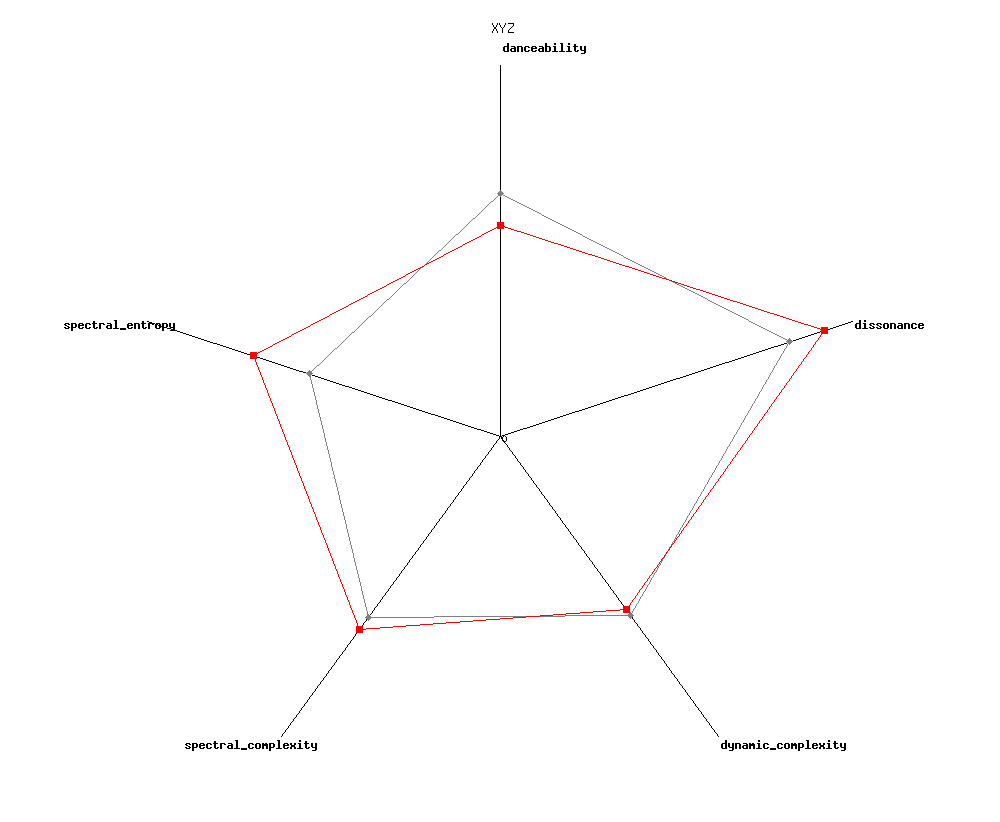
As you can see, this is not the sexiest chart. There are many many other libraries out there, but the one I chose was the simplest at the time. The red polygon represents the song in question ("XYZ" in the above case). Grey is for the average of all 26 tunes.
Anyway, here are the rest of the charts for the tunes from my last release, "X" (audio located on my YouTube channel): Tune Charts
As expected, my ambient tunes like Lush and Sol have smaller fingerprints, because they change the least in every way.
As an exercise for the reader, analyze Led Zeppelin or Frank Sinatra or whoever, with this technique. Just input their musicbrainz artist id, instead of mine. Might take a bit of tweaking of the code to filter the recordings. Also: Might take a while... Fun times!
~
UPDATE: Led Zeppelin in Seven Dimensions